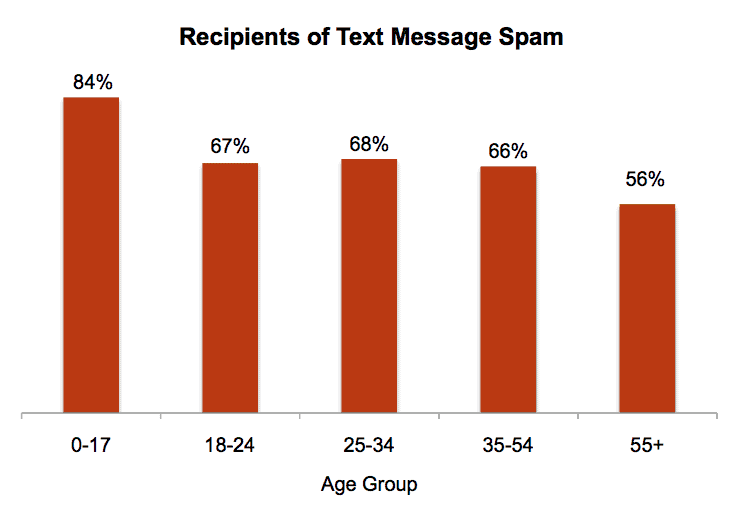
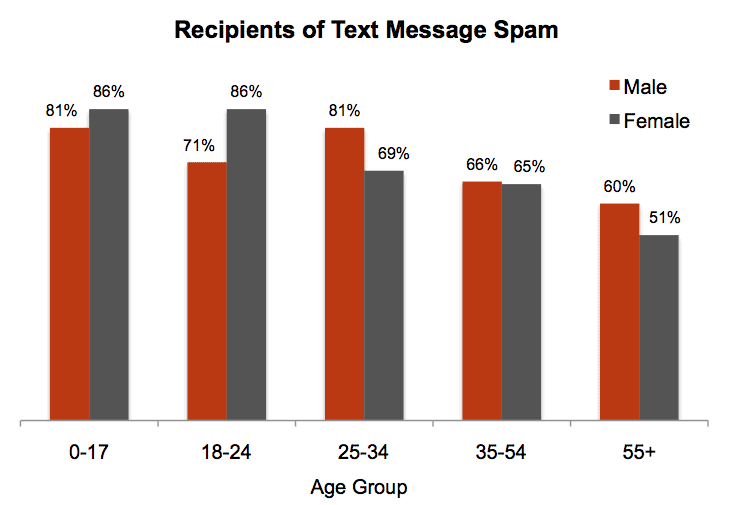
Last week we put out a text message spam infographic from the results of a survey we commissioned here at Tatango. This text message spam survey asked 500 U.S. consumers about their experience with text message spam. To elaborate on the data within the infographic, we’ve included the graphs of the text message spam statistics below. Hopefully this will help shed some light onto who in the U.S. is receiving text message spam and how big of a problem this is for the mobile marketing industry.
Interesting text message spam statistics from the survey:
- 68% of survey respondents say they’ve received text message spam. Tweet!
- Women under 17 are the most likely to have received text message spam (86%). Tweet!
- Women 55+ are the least likely to receive text message spam (51%) Tweet!
- Men & Women are equally likely to be the recipients of text message spam. Tweet!
Recipients of text message spam by age:

Recipients of text message spam by age and gender:

Survey Methodology
The 2011 Tatango Text Message Advertising Survey is a national survey designed to provide insight into consumer attitudes towards text message marketing and their mobile behavior. The survey was conducted in July 2011 through online survey platform, AYTM. The survey is based on 500 respondents (100 respondents per age category 0-17, 18-24, 25-34, 35-54, 55+) and all U.S. consumers. The survey is sponsored by Tatango.

