If you’re looking for the best, most recent SMS marketing statistics, you’ve come to the right place.
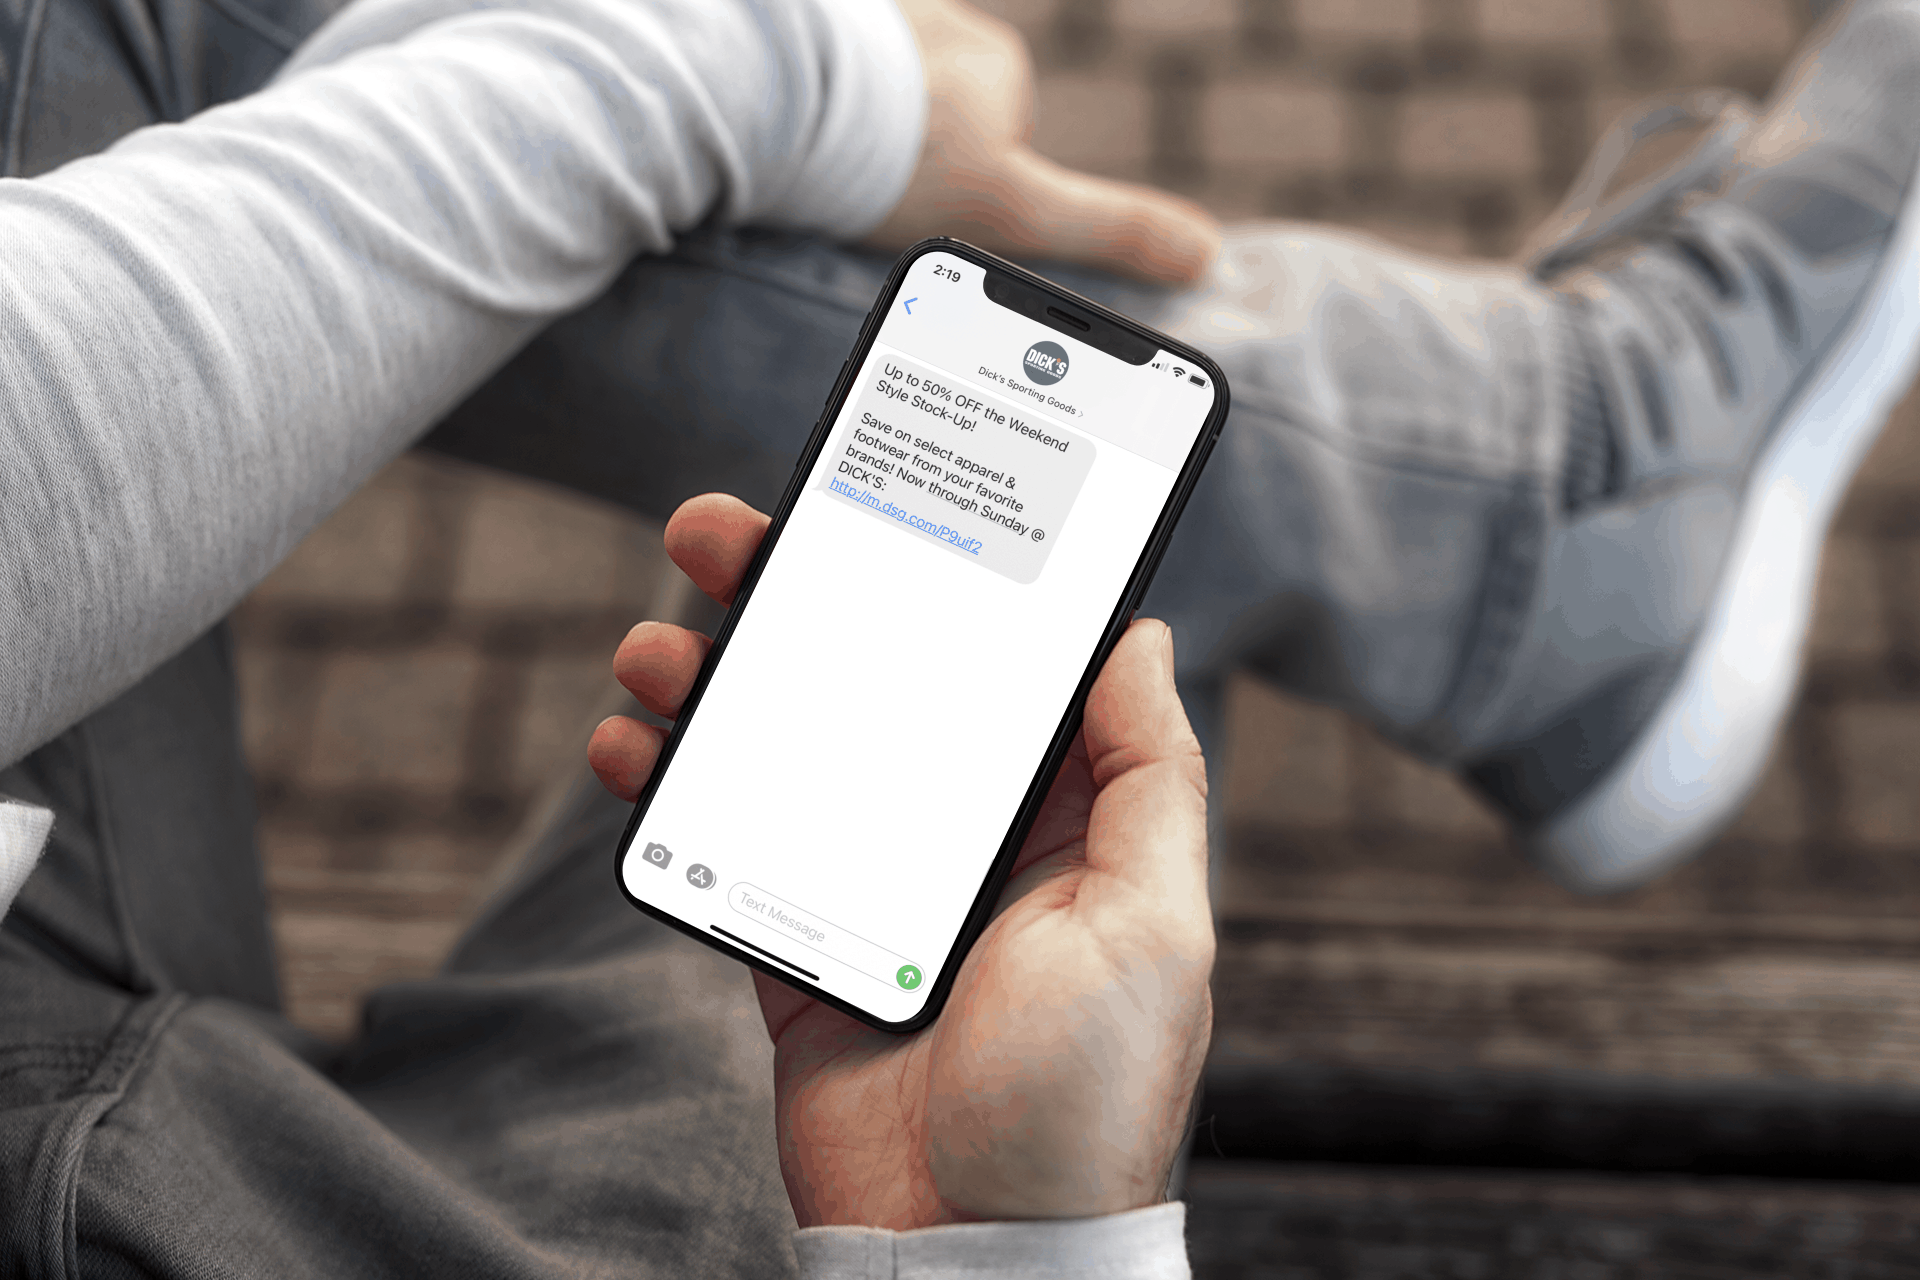
SMS marketing (also referred to as text message marketing) is when a brand or business sends a text message to a group of consumers. Typically, brands do this to promote a coupon, deal, event, or promotion. And it’s a smart strategy because text message marketing is unparalleled in the amount of engagement, revenue, conversions, and profit it drives.
Below, we’ve compiled statistics about SMS marketing open rates, click-through rates, engagement rates, opt-in rates, opt-out rates, and more. You can find stats on the types of messages that consumers want to receive and the types of advertisements that are most likely to get consumers to sign up for your text message marketing list. As the industry’s leading SMS marketing software provider for the past 13 years, we’ve seen what works, what doesn’t, and the actual data around SMS marketing. Keep reading because we share it all with you below.
SMS Marketing Subscriber Opt-In Statistics
First things first: let’s begin with the very first step of text message marketing. The first step to any great text message marketing campaign isn’t even the text message itself—it’s actually getting customers to opt in to receive your text messages. Due to a federal law called the Telephone Consumer Protection Act (TCPA), it’s illegal for businesses to send mass text messages to a smartphone user if that person hasn’t opted in to receive the messages.
So, once you have your dedicated phone number and your keyword (the word that consumers can use to opt in and join your text campaign) then you just need to figure out how you will attract mobile device users to join your SMS loyalty program. Below are some stats for texting opt-in rates from various digital channels, meaning the percentage of people who you can expect to opt in if you are promoting your text message marketing list on each channel:
- The SMS marketing opt-in rate for social media is 0.7% – 2.9%.[1]
- The SMS marketing opt-in rate for a website is 0.7% – 1.4%.[2]
- The SMS marketing opt-in rate for television is 1.0 – 2.4%.[3]
- The SMS marketing opt-in rate for email is 1.6% – 10.5%.[4]
- The SMS marketing opt-in rate for in-store is 2.3 – 3.2%.[5]
As you can see, email and in-store promotions are one of the best ways to grow your text marketing list, with conversion rates of up to 10.5%. Many companies promote their SMS marketing programs via email newsletters or put signs and banners around their stores promoting their SMS loyalty club to phone users. It makes perfect sense—if consumers are already in-store about to make a purchase, and they see a sign to save a percentage off their purchase, it’s a no-brainer to sign up and get a sweet deal in exchange. In fact…
- By offering an incentive to opt-in, businesses grew their SMS lists 520% faster.[6]
- The average restaurant SMS marketing opt-in rate is 791 subscribers per location.[7]
- 57.4% of people join text messaging loyalty programs to save money.[8]
We’ve seen brands get really creative with this and advertise their SMS program on restaurant table cards, fast-food bags, checkout signs, and more. It’s as simple as telling customers to sign up to receive a percentage off their next purchase, or any other deal like buy-one-get-one-free, dollars off, or special deals sent straight to their phones. Most consumers are happy to save a few bucks and willingly give their phone numbers in exchange.
Statistics on Where Brands Acquire Mobile Subscribers
When it comes to actual people—and not just the conversion rates—which percentage of consumers opt in using various digital marketing channels? A study was conducted about the marketing strategies of retailers to determine what methods they use to acquire mobile phone numbers. The following data shows the percentages of consumers and how they opted in:
- Percentage of people who opt in via web form: 58% [9]
- Percentage of people who opt in via email: 47% [10]
- Percentage of people who opt in via mobile phone: 43% [11]
- Percentage of people who opt in via point-of-sale: 37% [12]
- Percentage of people who opt in via print campaigns: 32% [13]
- Percentage of people who opt in via social media: 31% [14]
- Percentage of people who opt in via rewards center: 13% [15]
SMS Marketing Database Size
For those marketing professionals who are new to the texting world and are curious to know what is realistic for text message marketing mobile phone number databases, we’ve got you covered. A study that compared the sizes of a retailer’s email list to their mobile phone number subscribers found that:
- Retailers can expect an SMS database equal to 2% to 10% of their email database. [16]
The good news is that text message marketing can actually help marketers grow their email lists, too. In fact, 22% of retailers use text messaging to capture customers’ email addresses.[17] Think about it: if people are willing to provide their personal phone number, they’re typically more than willing to also provide their email address, which feels less personal, to begin with. Many brands simply invite their text message marketing subscribers to reply back to a text message with their email address. It’s quick and easy, and then brands have two methods to reach mobile users and engage them with great deals.
Mobile Marketing Open Rate Statistics
Without even looking at the stats, it’s pretty safe to assume that most people open all their mobile messages… no one likes a cell phone with a whole bunch of unread SMS message notifications glaring at them! (Don’t ask us about our email inbox though… that’s another story.) The data about SMS messaging open rates is astonishing. Studies show that:
- The average open rate for SMS messages is a phenomenal 99%.[18]
- A MobileSquared report confirms that SMS marketing read rates exceeded 99%.[19]
- Compared to email marketing, which is lucky to get 20% open rates [20], text marketing’s unbeatable open rates make it a no-brainer as another channel on which to reach customers… if not THE channel.
Mobile Marketing Click-Through Rate Statistics
Now you may be thinking… ok, so texting has great open rates, but what about the click-through rates? Are subscribers actually taking action once they open and read the messages? Check out these click-through rate (CTR) statistics to find out:
- SMS software companies show an average 46% click-through rate on SMS messages.[21]
- A study showed an average click-through rate for SMS marketing is closer to 6.16%.[22]
- Non-recurring messaging campaigns show up to 92% SMS click-through rates.[23]
- The better the offer, the better the click-through rate. This client got a 34.23% CTR.[24]
- 43% of SMS responses occur within 15 minutes.[25]
As you can see, click-through rates vary based on the value of the offer in the text message, the type of campaign, and the source of the study. However, comparing texting to emailing, even text messaging’s click-through rate of 6% still outperforms email’s click-through rate of around 2%.[26]
Mobile Marketing Consumer Preference Statistics
Ok, so once you’ve done the hard work of setting up your texting campaigns and growing your list, what do you text your subscribers? Below are stats about what consumers want to receive via text messaging. By texting consumers messages that add value, you can ensure that they are more likely to open and engage with your messages.
When consumers were asked what types of companies they prefer to hear from via SMS, this is what they said:
- Percent of consumers who want banking/financial text message alerts: 67%.[27]
- Percent of consumers who want retail store text message alerts: 64%.[28]
- Percent of consumers who want travel text message alerts: 55%.[29]
- Percent of consumers who want restaurant text message alerts: 55%.[30]
- Percent of consumers who want service company text message alerts: 44%.[31]
- Percent of consumers who want transportation text message alerts: 39%.[32]
- Percent of consumers who want insurance company text message alerts: 35%.[33]
- Percent of consumers who want consumer electronics text message alerts: 33%.[34]
When consumers were surveyed about what device they want to receive transactional type messages (such as an appointment reminder) on, consumers said overwhelmingly that they would prefer to receive these messages on their smartphone. In fact, the statistics show that consumers actually prefer if a company text messages them and might think less of a company that makes them wait on hold over the phone or doesn’t have a texting option. That means, no matter what kind of business you work for, it helps your reputation to have texting functionality. Let’s look at the data.
- 70% of consumers prefer to receive transactional messages on their mobile phones.[35]
- 77% of consumers ages 18 to 34 have positive perceptions of brands with texting.[36]
- 12% of consumers’ text message interactions are with businesses.[37]
- 44% of consumers would prefer to press a button to initiate a text conversation immediately, rather than waiting on hold to speak with an agent.[38]
- 81% of all consumers don’t like waiting for customer service on a phone or computer.[39]
- 78% of consumers say that text messaging is the fastest way to reach them.[40]
Consumers repeatedly state that text messaging is faster for them than receiving an email on a smartphone, seeing a push notification, or even checking an email on a computer or tablet device.[41] With all of those great stats, it’s clear that consumers want you texting them if you aren’t already. Fortunately, we can make it pretty easy to get you up and running.
Enterprise Text Marketing Statistics
Because we mainly work with enterprise brands, we have to throw in some enterprise SMS marketing statistics for our friends in the enterprise world. Fortunately, text marketing is being widely adopted by enterprise brands, from major retailers like Bloomingdale’s and Best Buy to enterprise restaurant chains like Chili’s and Cold Stone Creamery. (Speaking of, check out 33 examples of enterprise brands using text message marketing.) But first, let’s look at the stats:
- 86% of enterprise businesses are using MMS marketing.[42]
- SMS ranks #1 among enterprise businesses.[43]
- 82.4% of people are more likely to shop at a store with an SMS loyalty program.[44]
Opt-Out Stats
You may wonder… if you incentivize customers to opt into your campaigns with great mobile coupons, won’t they just opt out once they get the deal? Actually, opt-out rates are very low.
- The average opt-out-rate for retail SMS marketing is 3.7%.[45]
- The average opt-out rate for retailers is even lower, at only 1.8%.[46]
That means that, on average, you will only lose around three subscribers for every 100 people you send a text message to. Or if you’re a retailer, that number is even lower, at just under two people for every 100 you message. So rest assured, as long as you continue to send valuable content, most people will continue to participate long after they take advantage of your first offer.
SMS Marketing Results Stats
With all of these great stats about the industry as a whole, we thought it would be fun to share a few actual examples of numbers, statistics, and results that real companies received. Check these out:
- Julep generated 5,000 customer opt-ins within the first 24 hours.[47]
- Tao Nightclub generated an 11% redemption rate.[48]
- Avenue Stores reported a 6,600% ROI from MMS coupons.[49]
- Carl’s Jr. generated $14 in new sales for every $1 they spent.[50]
- Silverstone generated an ROI of 680% with one message.[51]
- 73% of those who signed up for Kiehl’s SMS campaign made a purchase.[52]
- Chuck E. Cheese’s SMS subscribers click on coupons 10% more.[53]
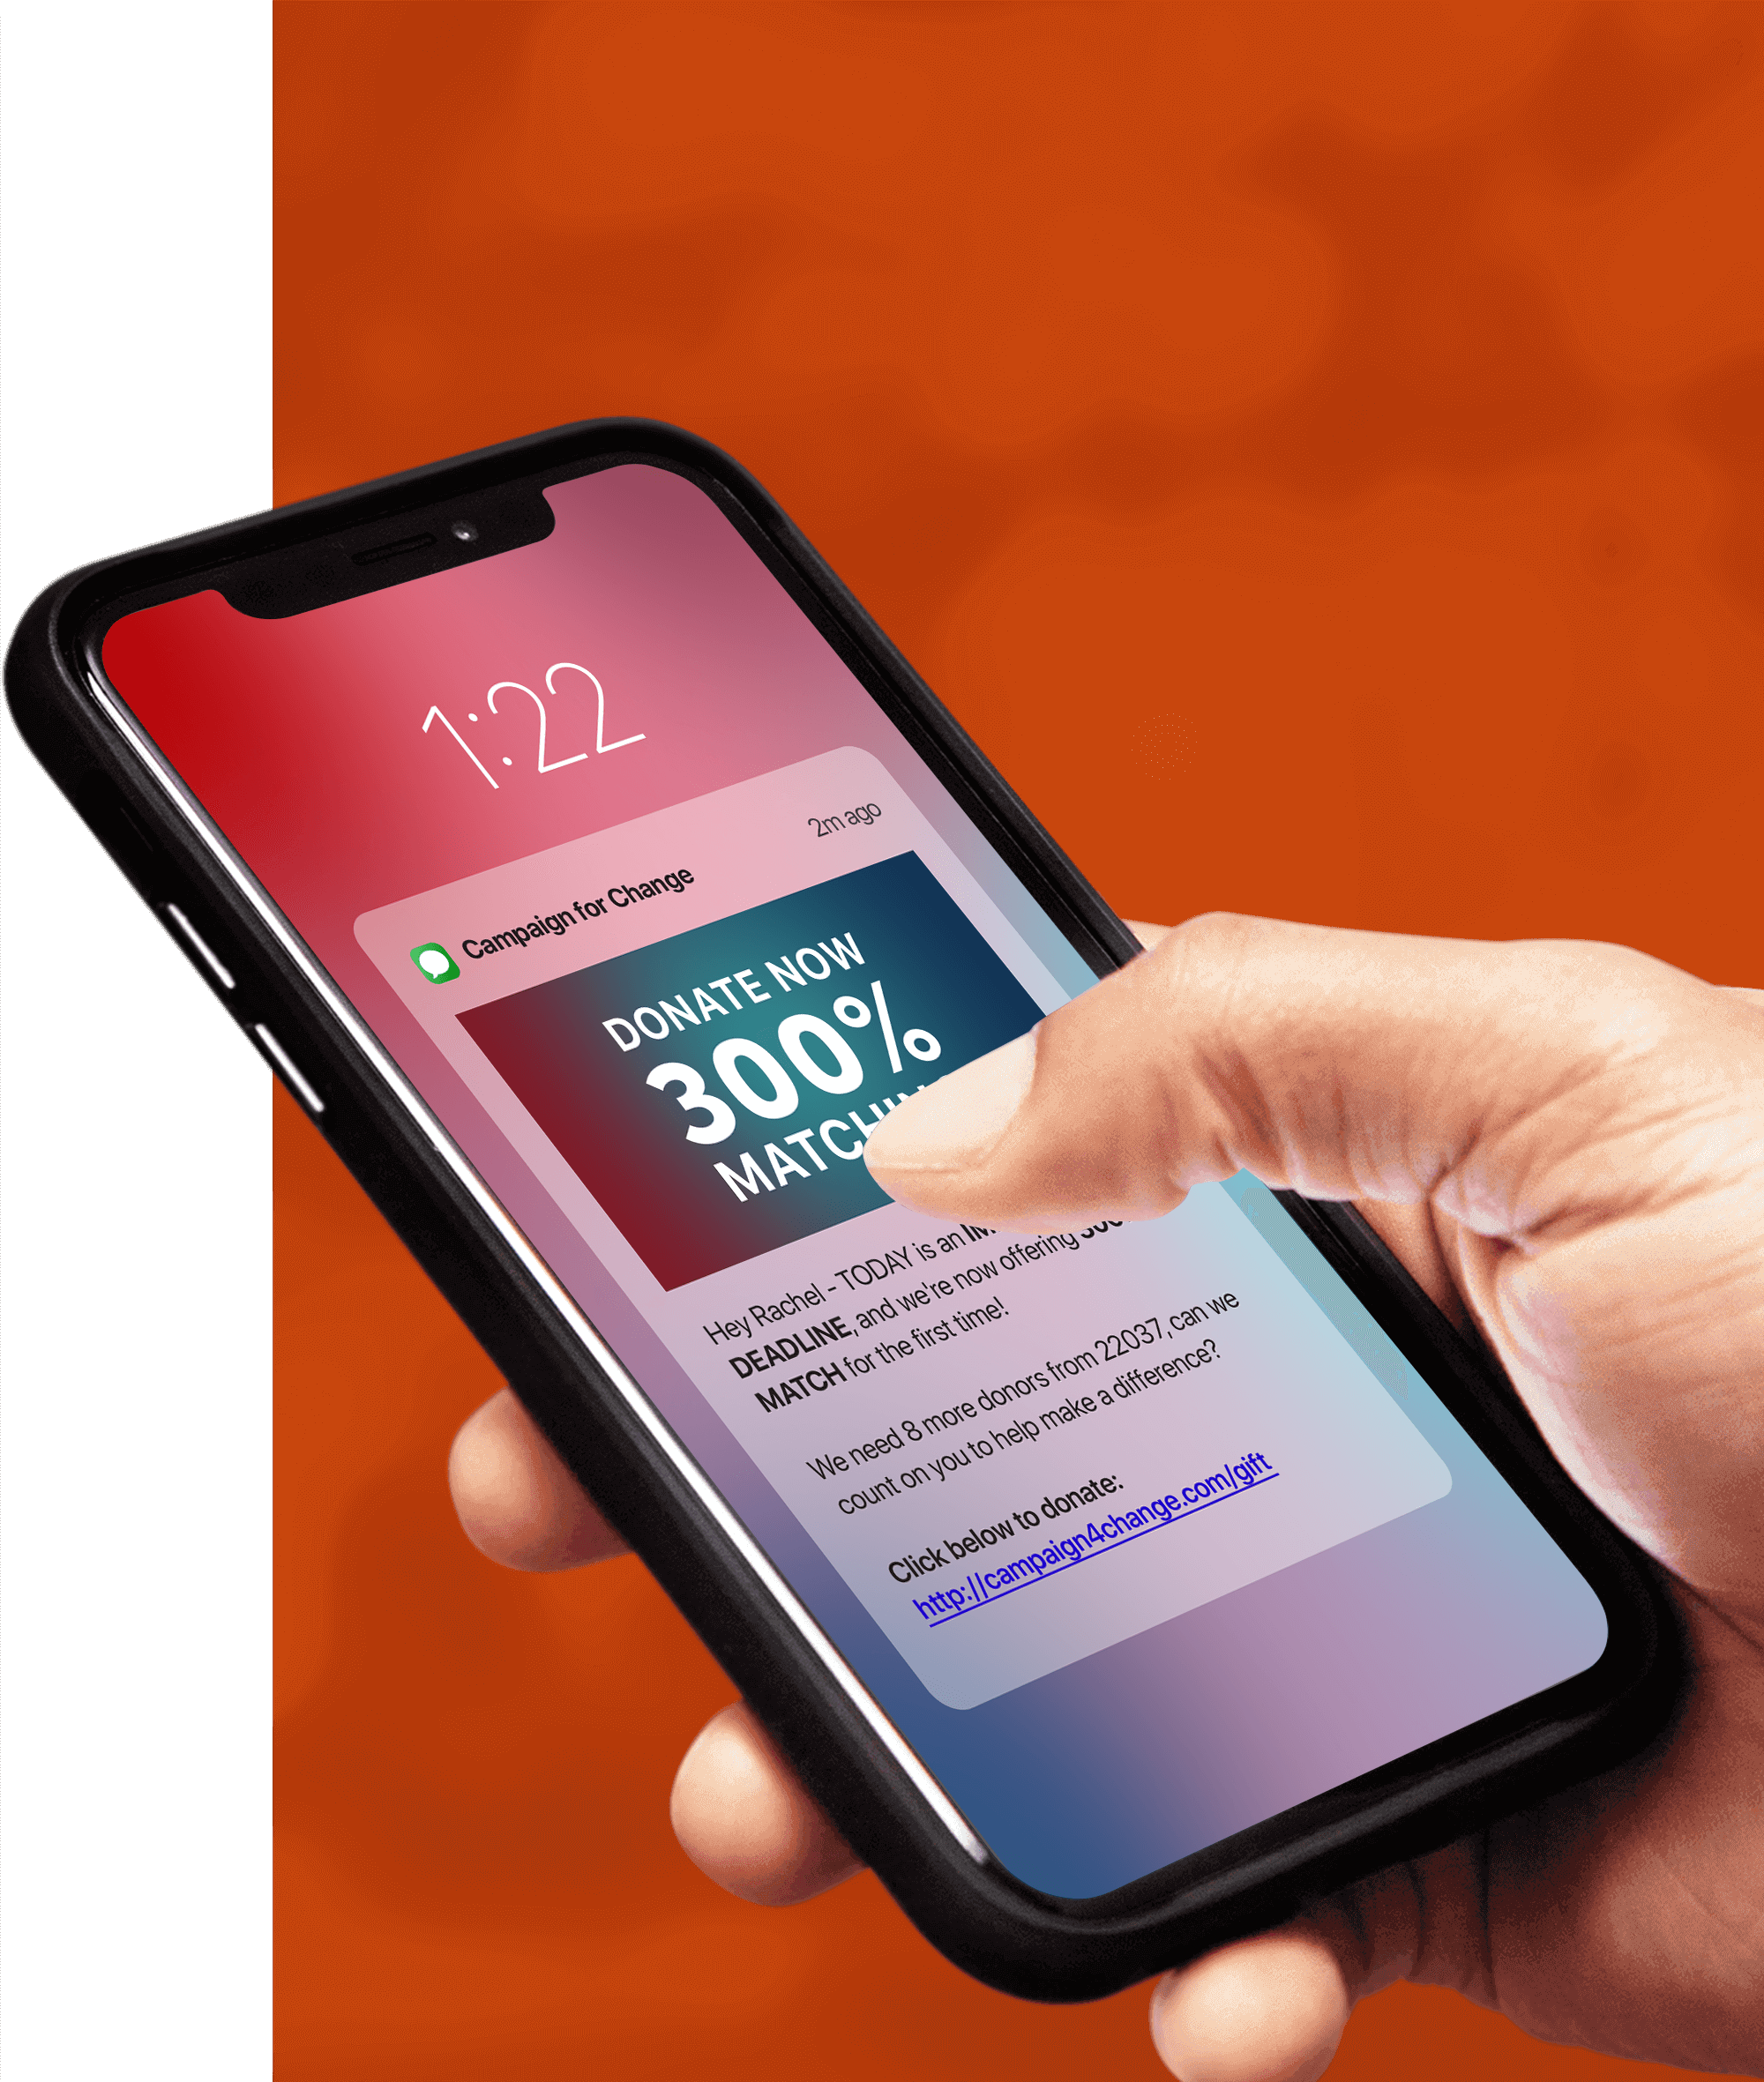
- 25,000 people opted into one Peta2 nonprofit mobile campaign.[54]
- National Wholesale Liquidators SMS subscribers spent 80% more.[55]
- Texas Roadhouse generated a 17% redemption rate.[56]
- 35% of Dunkin’ Donuts SMS subscribers considered themselves more likely to buy.[57]
- Ford’s mobile marketing campaign generated a 15.4% conversion.[58]
- One Papa John’s franchise increased overall sales by 33% during a three-week campaign.[59]
- Pirq generated a 92% click-through rate.[60]
- Pizza Hut found SMS to be 142% more efficient in increasing sales.[61]
- One Subway franchise averaged a 9% redemption rate on their campaign.[62]
- Bulmers Irish Cider received a 50% click-through rate on one text.[63]
Getting Started with SMS Marketing
Now that you know all there is to know about promotional SMS marketing, you’re aware that it’s the single most effective way to reach customers, to achieve the highest open rates of any other marketing channel, to showcase your products with colorful images and GIFs, to measure click-through rates and the revenue generated from each message, and to reach your customers in real-time on the mobile devices that they always have within reach.
With results like that, are you ready to get started crafting your own SMS marketing campaign? If so, contact our team of SMS marketing experts. We’ll walk you through the entire process of creating a successful messaging campaign including developing your marketing strategy, choosing the best short code and keywords for your target audience, provisioning your short code, ensuring you are within legal regulations, creating an irresistible opt-in incentive, crafting branded text messages, and measuring your results in an SMS marketing tool. We’ve been the industry leader for SMS text marketing for the past 13 years, and we would love to help you turn these mobile messaging statistics into a campaign that generates new leads, revenue, and results for you. Contact us today.
P.S. Haven’t had enough yet? Check out even more great SMS statistics articles.